Why Load Decides What an Electrical Thermogram Means
A thermal image of a distribution board looks like an answer. Often it is only half of one. The colours show where the board is warm, but not why, and the reason behind the warmth decides whether it is normal working or the first sign of a connection that needs an electrician’s attention.
Every current-carrying part of an installation warms as it works, and a heavily used circuit is meant to run warmer than a quiet one. A high-resistance connection warms too, and on a lightly loaded board the two can look much the same, or the fault can barely show at all. What separates them is the load the circuits were carrying when the image was taken. Without that, a thermogram can be read as a healthy circuit working hard or as a connection beginning to fail, and the person reading the report has no way of telling which. That is why load is recorded on site, board by board, before a single image is classified, and why it appears plainly in every report we issue.
This post is for facilities and compliance managers, electrical contractors and anyone answering an insurer’s questionnaire about the fixed wiring. It explains how load is established during a survey, how it changes the confidence of a finding, and why the heating season, when many buildings run their heaviest and steadiest electrical demand, is often a good time to book a thermographic survey of the boards, and what you can do to make sure the survey sees the installation as it really runs.
Why Load Decides What an Electrical Thermogram Means
A warm circuit and a failing connection can look alike until the load is known.
Reading Heat Against the Load
Two images that can look the same
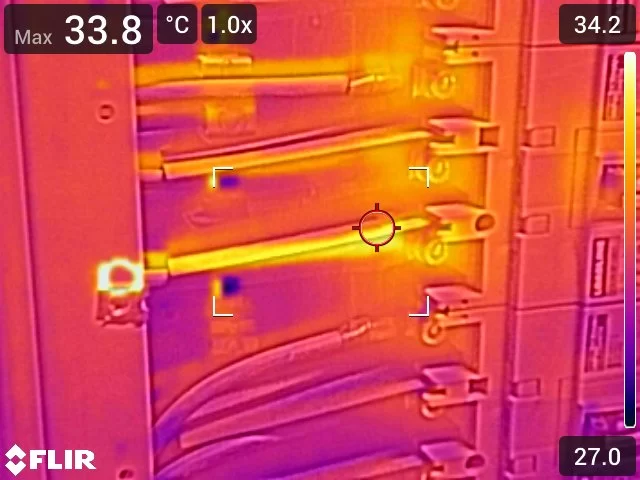
Picture two distribution boards photographed with the same calibrated radiometric thermal camera. On the first, a run of circuits glows warmer than the rest of the board. On the second, one circuit stands out in much the same way. Without more information, both images say only that something is warm.
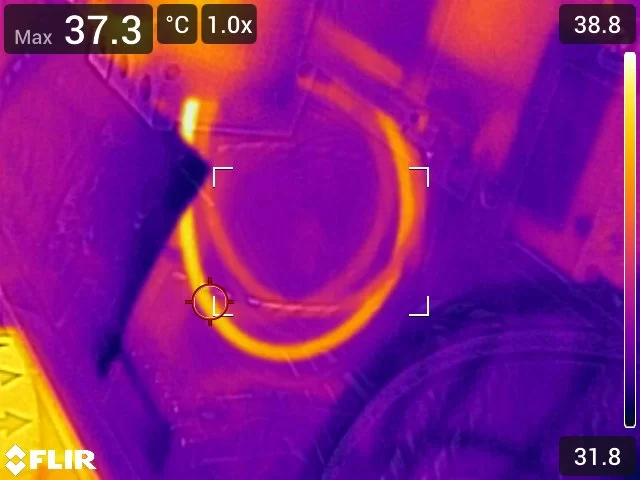
The difference lies in the pattern and in the current behind it. Warmth that comes from load is spread along the whole conductor or across the whole body of a device, it changes gently over its length, and it is similar on circuits carrying similar current. Warmth from a high-resistance connection is concentrated at the joint or termination, falls away sharply within a short distance, and stands out from comparable circuits carrying comparable load. Load is what lets the thermographer tell one from the other with confidence.
Why current matters so much
The heat produced at any point in a circuit depends on the resistance there and on the square of the current passing through it. That second part is the one people underestimate. Halve the current and the heat generated at a poor connection falls to a quarter, so a joint that would stand out clearly at full working load may sit only slightly above its neighbours when the building is quiet.
This works in both directions. A board carrying very little current can hide a developing fault, because there is not enough current to make it show. A board carrying heavy but normal load can look alarming to an untrained eye, because healthy conductors legitimately run warm. A thermal image on its own cannot settle which situation it is showing. The load state can.
How load is established on site
Load is recorded for each board, and where it varies across a site it is recorded board by board rather than once for the visit. There are four ways it can be captured, and the report says which one applied:
- A clamp measurement taken at the board and recorded, which gives a figure to read the image against.
- Load confirmed as representative on site, with no figure retained, which is acceptable for condition screening and stated as such.
- Load attested as representative by a competent person at the installation, such as the client’s own electrical contractor, with the basis of that attestation stated.
- No load captured at all, in which case the reason is recorded and the limitation carried into the findings.
The international guidance on condition monitoring thermography points the same way. It asks the client to make sure the equipment is under adequate load, to allow recently energised equipment time to settle into a stable thermal pattern, and to measure electrical loads when the thermographer asks. It also suggests the report gives the rated load of the item and the load measured at the time, wherever that is possible.
What a partial load does to a finding
Where a board is confirmed as carrying representative load, and its warming is even, symmetrical across comparable circuits and consistent with that load, the observation is recorded as normal operation. The image still shows what was measured, and the annotation explains why no consequence arises, but it is not treated as a defect.
Where load is partial or cannot be confirmed, that shortcut is not available. The pattern alone cannot be trusted to separate load from a fault, so the observation is classified on its temperature difference and the confidence of the finding is capped. The report then says so in plain words. A finding made under light load is not wrong, but it is less certain, and anyone relying on it needs to know that.
A load exception, recorded honestly
Load is rarely all or nothing. On a hospitality venue in South Wales in July 2026, the client confirmed the site was running at typical load, with two exceptions: the televisions were switched off and the kitchen fryers were not yet on. The two kitchen boards were marked as partially loaded, and the exception was written into the load limitation in the report. Where the boards serving the excepted equipment could not be identified, the reading of any distributed warming on boards that might serve them was made cautiously rather than mechanically.
That kind of detail matters more than it seems. An insurer or an electrician reading the report later can see exactly what the image could and could not show, rather than assuming every board was tested under the same conditions.
Why winter often helps
For many commercial buildings, the colder months bring the heaviest and most sustained electrical demand of the year. Lighting runs for longer, electric and supplementary heating comes on, heat pumps and air handling work harder, and kitchens, plant rooms and process loads keep running alongside them. A survey carried out on a working weekday in that season is more likely to find the circuits carrying representative load than one carried out on a quiet summer afternoon.
That does not make a summer survey worthless, and some sites peak at other times of year, such as buildings with heavy cooling loads. The principle is simple: survey when the installation is doing its normal day’s work, and for a great many offices, schools, shops and care settings that is a winter weekday.
Booking the survey at the right time
The most useful thing a client can do is tell us when the building is genuinely busy. Avoid a closed weekend, the first hour after opening, or a day when key plant is off for maintenance. Equipment that has only just been switched on needs time to settle before its thermal pattern means anything, so a survey slotted in after normal operation has been running for a while gives the clearest picture.
It also helps to have someone on site who knows the installation and can say which boards serve which loads. Whether the boards sit in an office in Brighton, a warehouse near Maidstone, a school in Guildford or a care home outside Reading, the same question comes first: is this board carrying the load it normally carries?
What the report says about load
Every report states the access state and the load state plainly, board by board where they vary. Boards surveyed with covers removed under confirmed representative load carry full classification confidence. Where load was partial, unconfirmed or attested by a third party, the limitation is written into the report rather than left for the reader to guess. Findings point to a suitably qualified electrician to investigate, and the report never prescribes the repair. Every report is written and certified by our Level 3 thermographer.
If you are planning a thermal inspection of your electrical distribution boards, timing it for a busy winter weekday gives the survey the best chance of showing what it should. You can read more about our wider electrical thermal imaging work as well.
ISO 18434-1:2008
Load and Operating Conditions
ISO 18434-1:2008 sets out the general procedures for infrared thermography used in condition monitoring, and it is the international framework our electrical methodology is aligned with. It treats the operating condition of the equipment as part of the measurement, not an afterthought. Among the duties it places on the client of a thermographic service are making sure the equipment is under adequate load, allowing recently energised equipment enough time to produce a stable thermal pattern, and measuring electrical loads when the thermographer asks. For quantitative work it suggests the report gives, wherever possible, the maximum rated load of the item and the load measured at the time of the inspection. It also points the thermographer towards comparing like with like: a similar component under the same or similar operating conditions. That is the basis of reading heat against load, and of stating clearly when the load fell short.
Book a Loaded Survey
Thermography Services (UK) carries out Level 3 thermographic condition screening of electrical distribution boards for facilities managers, electrical contractors and owners answering insurers. We agree with you when the building runs its normal working load, record that load board by board, and state plainly in the report what each image can and cannot show. Every report is written and certified by our Level 3 thermographer. Tell us about your site and we will propose a suitable survey window.