
Building th
Heat Loss Surveys and Home Thermal Imaging Surveys
Home thermal imaging surveys that show where your house loses heat, analysed and explained in a certified Level 3 report.
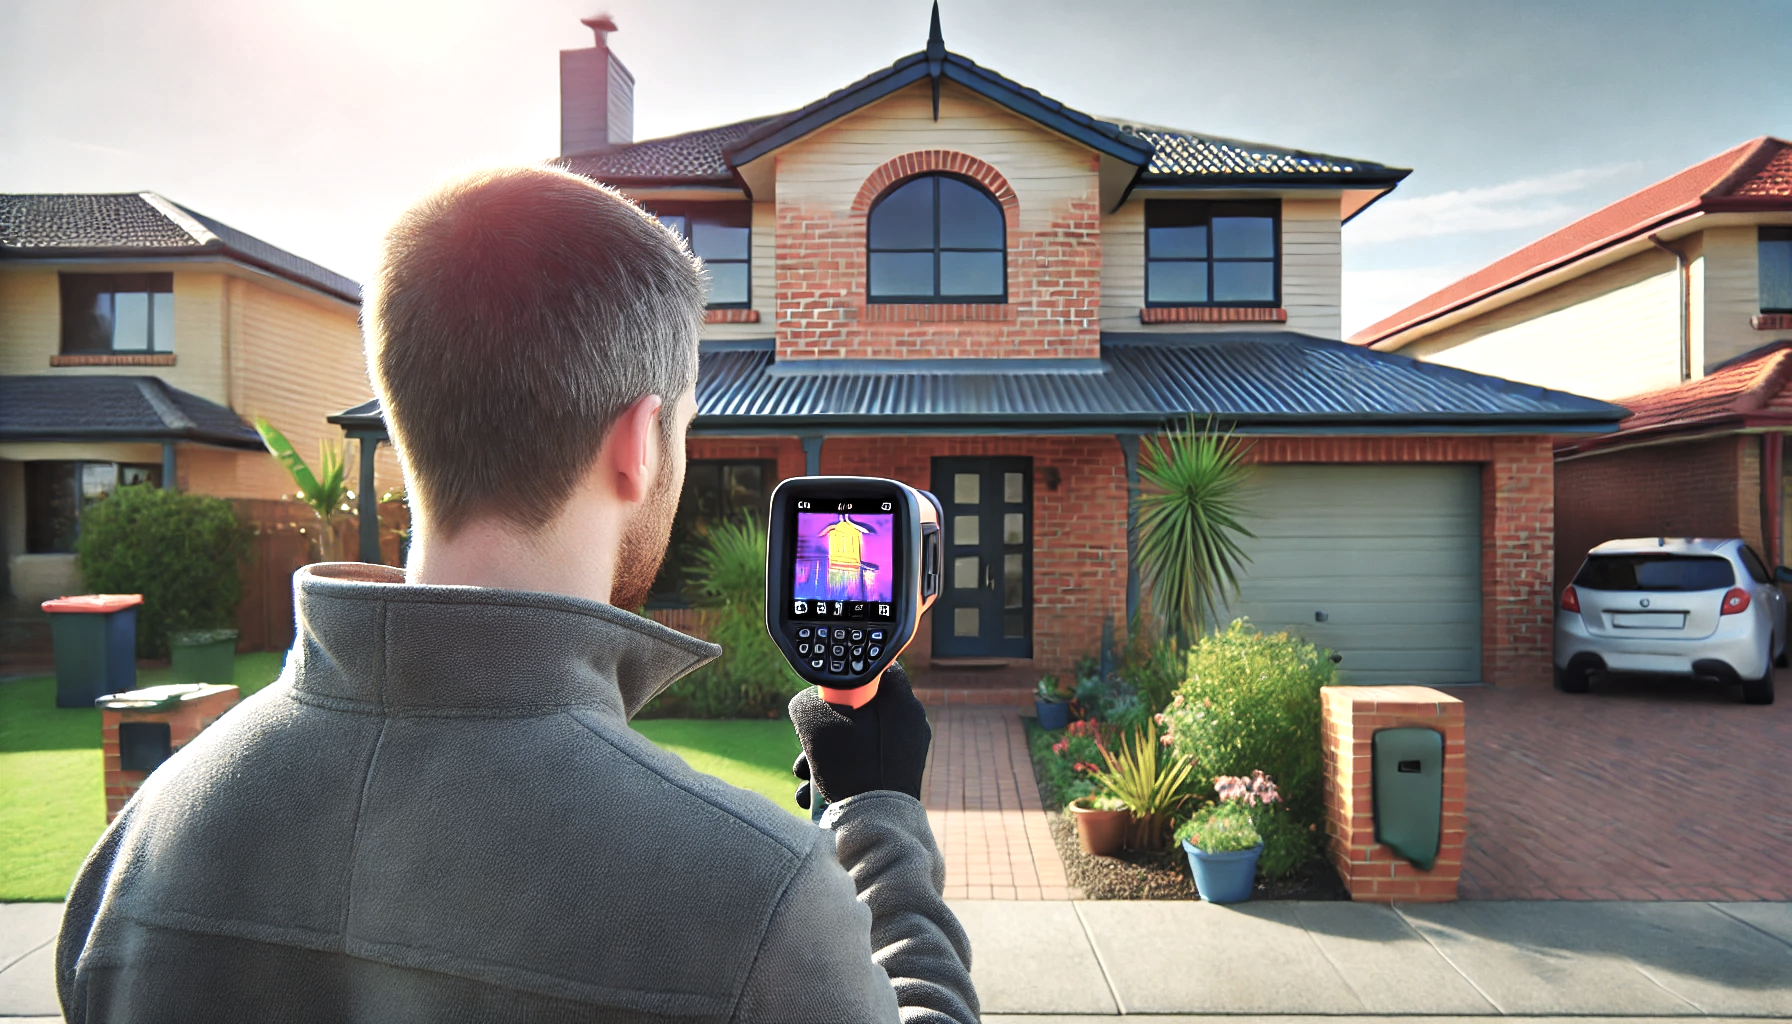
A heat loss survey uses a thermal imaging camera to show where warmth is escaping from a home: through walls, lofts, windows, doors and the junctions between them. It is non-invasive, so nothing is drilled, lifted or opened up, and it gives homeowners, landlords and their builders a clear picture before money is spent on insulation, glazing or heating.
Thermography Services (UK) carries out house thermography inside and out. Every image is analysed by our Level 3 thermographer and explained in plain language in a certified report, so you know what each pattern indicates, why it matters and where to look first.
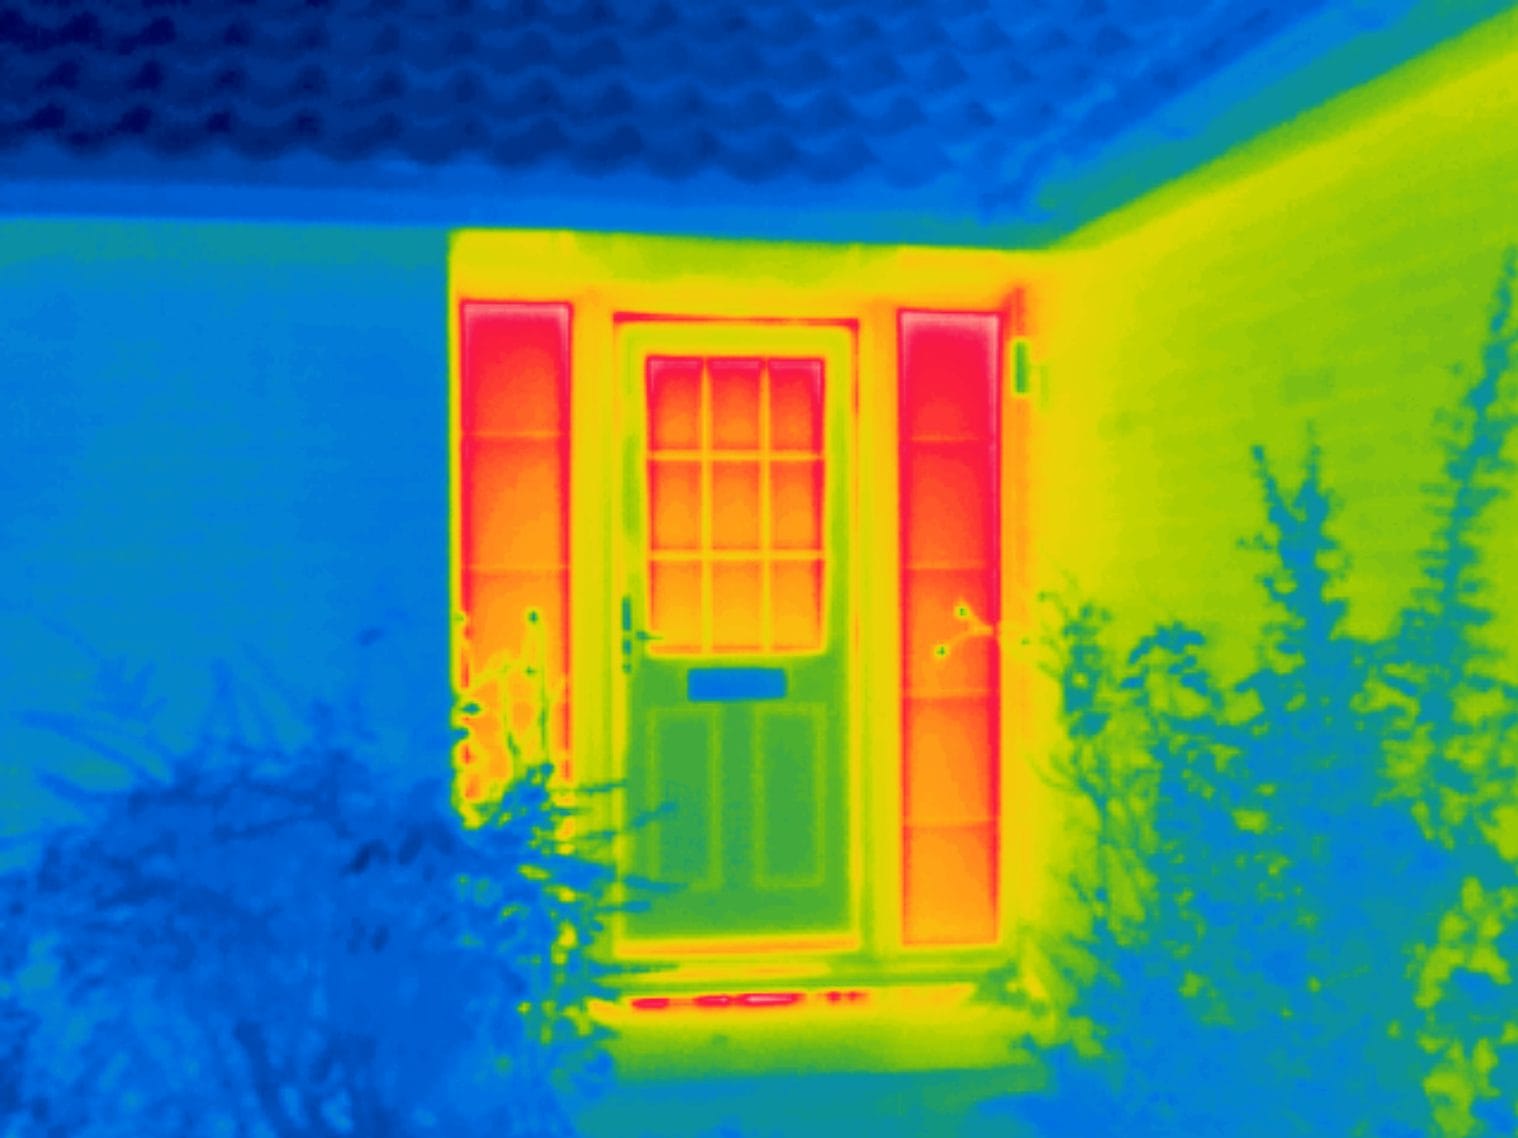
See exactly where your home loses heat, and understand what each pattern means.
Most homes lose heat in places nobody can see. A cold bedroom, a draught at the skirting or a heating bill that keeps climbing all point to warmth escaping somewhere, yet the walls and loft look exactly as they always have.
A heat loss survey takes the guesswork away. A calibrated radiometric thermal camera records the surface temperature of the whole building envelope, outside and, where access is given, room by room inside. Where insulation is thin, missing or has slumped, where part of the structure bridges from inside to outside, or where air leaks through a gap, the surface shows a pattern the camera can see. The survey is carried out in cold weather, before sunrise or after dark, with the heating on and the house closed up, so the difference between inside and outside is large and steady and no sun is warming the walls. A matching photograph is taken with every thermal image, so each pattern can be checked against what is physically there, such as a vent, a flue, a radiator or a recent repair.
Then comes the part that matters. Our Level 3 thermographer reviews every image, separates genuine heat loss from patterns that only resemble it, and explains each finding in plain language: what is seen, what it is consistent with and why it matters. Findings are set in order of priority, with thermal and visual images side by side, so the most significant losses are dealt with first. The certified report gives you, your builder or your energy assessor a clear picture of where the house is losing heat, and a record to compare against once any work is done.
Home thermal imaging surveys that show where your house loses heat, analysed and explained in a certified Level 3 report.
Page Subjects
heat loss surveys, house thermography, thermal imaging house inspection, home thermal imaging survey, building heat loss detection


Page Tags
heat loss survey, home thermal imaging, house thermography, domestic thermography, energy efficiency, building thermography
Request a Heat Loss Survey Quotation
Every home is different, so every heat loss survey is scoped to the property, its construction, the rooms you want covered and the question you need answered. Tell us about the house, what you have noticed, whether internal access is possible and whether the survey is for your own planning, a builder or an energy assessor, and we will come back with a clear proposal and a quotation for the work, including a suitable survey window.
How a house loses heat
Reading Heat Loss in Homes
Heat always moves from warm to cold. In winter, the warmth inside a heated home travels outwards through every part of the building fabric, and how fast it travels depends on what it has to pass through.
Good insulation slows it down. Where insulation is thinner, missing, compressed or damp, heat passes through more quickly, so the outside surface of that area is a little warmer than its surroundings and the inside surface a little cooler. A thermal camera shows the difference as a distinct shape: a patch of loft where the insulation has been pulled back, a band along a ceiling where it never reached the eaves, a section of cavity wall where the fill has settled or never arrived at all.
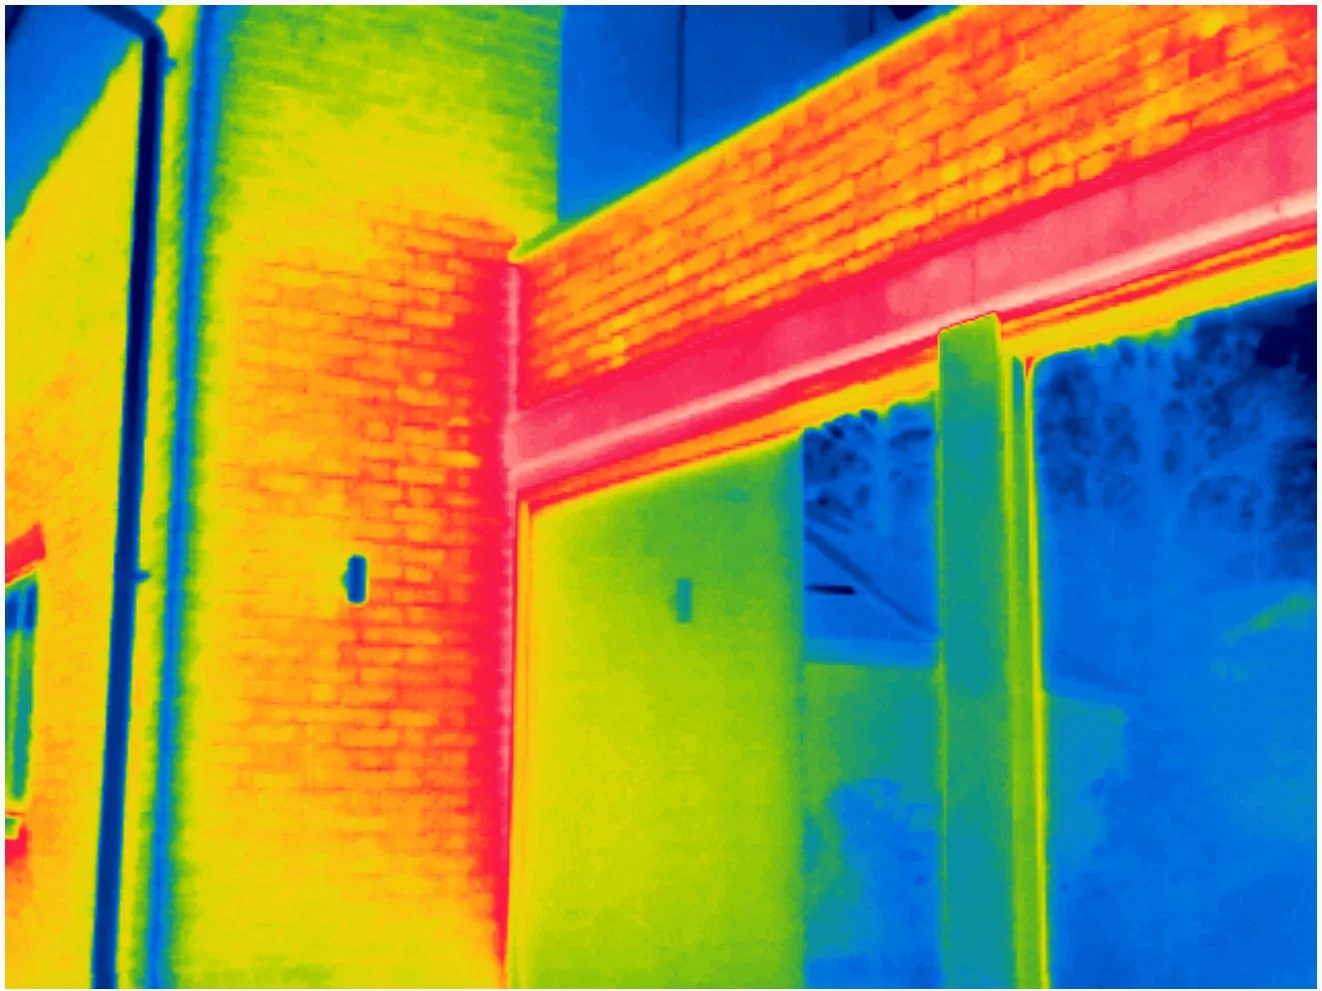
Thermal bridges look different. A lintel, a concrete floor edge or a steel beam running from inside to outside carries heat straight across the insulation, and the pattern follows the line of the structure. Bridges are common at window heads, floor edges and the junction between an extension and the original house.
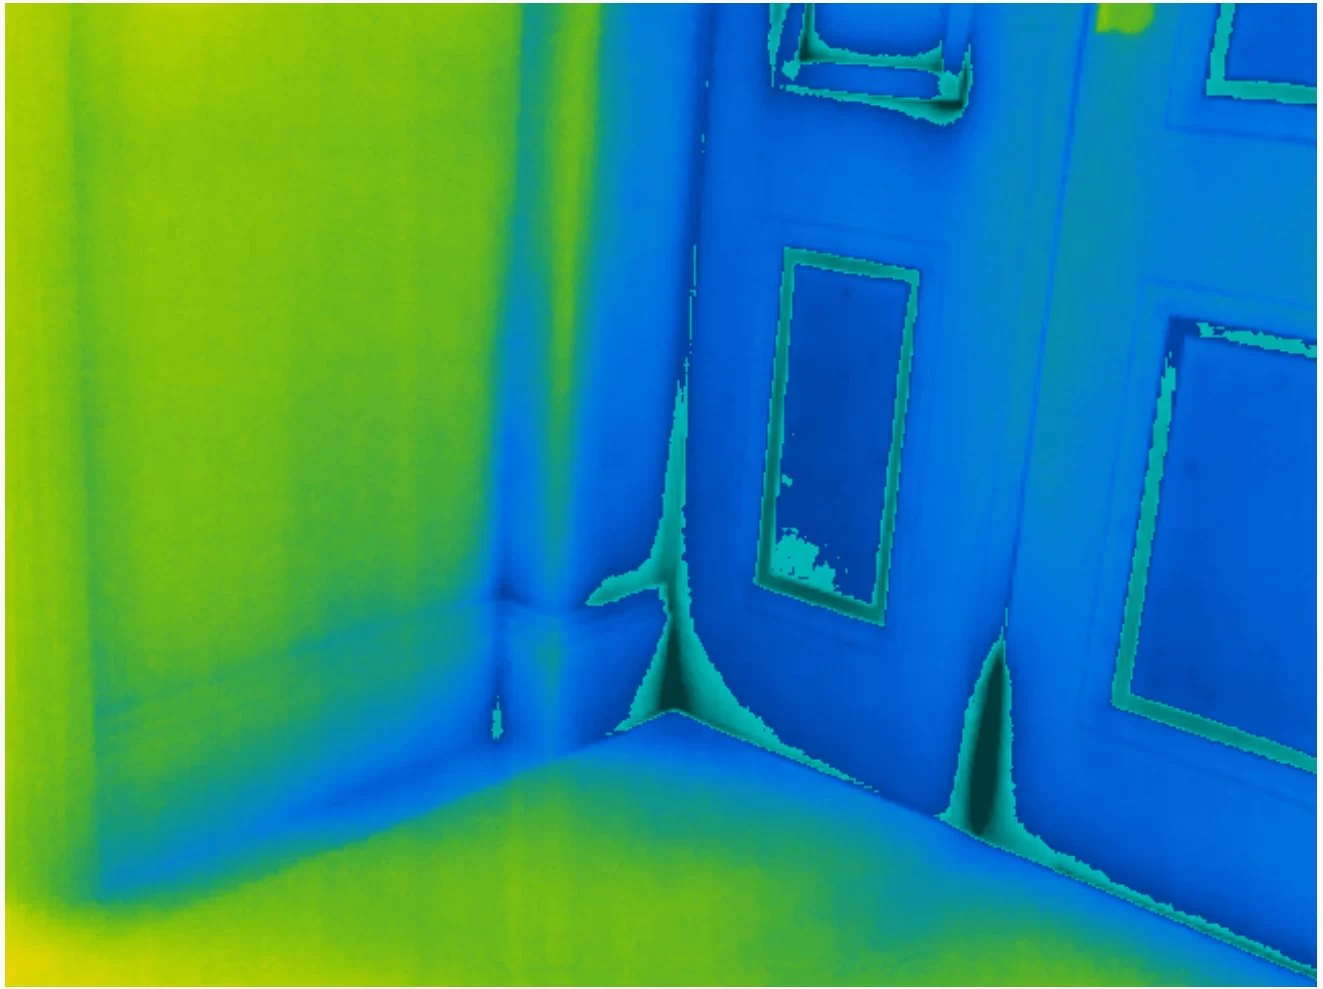
Air leakage looks different again. Where warm air escapes through a gap around a window frame, a pipe entry or a loft hatch, the moving air cools the surface around it in a feathered, directional pattern rather than a hard-edged shape.
Telling these apart is the skill. Sunshine on a wall, a radiator behind it, a flue, an extractor fan or a wet patch after rain can all produce patterns that look like heat loss but are not. That is why conditions are recorded, why every thermal image has a matching photograph, and why a north-facing wall is captured as a control. Brick, render, timber and glass also read differently on camera, so each surface is assessed for what it is.
The result is a survey that says not just where the house is cold, but why, which is what lets the money be spent in the right place.
How a home survey works
Conditions, Access and the Report
A heat loss survey only works when the house is giving off heat steadily. The heating is run normally for at least 12 hours beforehand, with windows and external doors kept closed, and the survey is timed for a cold morning before sunrise or an evening after dark, when the inside of the house is at least 10 °C warmer than the outside and no sun is on the walls.
Outside, each elevation is recorded square on and then in overlapping frames that cover every part of the face, with corners, junctions, windows and doors captured on their own. Inside, where access is given, each room is recorded wall by wall, with the room temperature noted and furniture moved away from the walls where that is practical.
Conditions on the day are checked against the method. If rain in the previous day, strong wind or early sun would make the images unreliable, the survey is moved to a better window rather than carried out in poor conditions.
The certified report sets out the conditions, the coverage and every finding in order of priority, with thermal and visual images side by side, so your builder, energy assessor or architect can see exactly where to investigate and why.

Case Study
Heat Loss Survey of a Surrey Bungalow
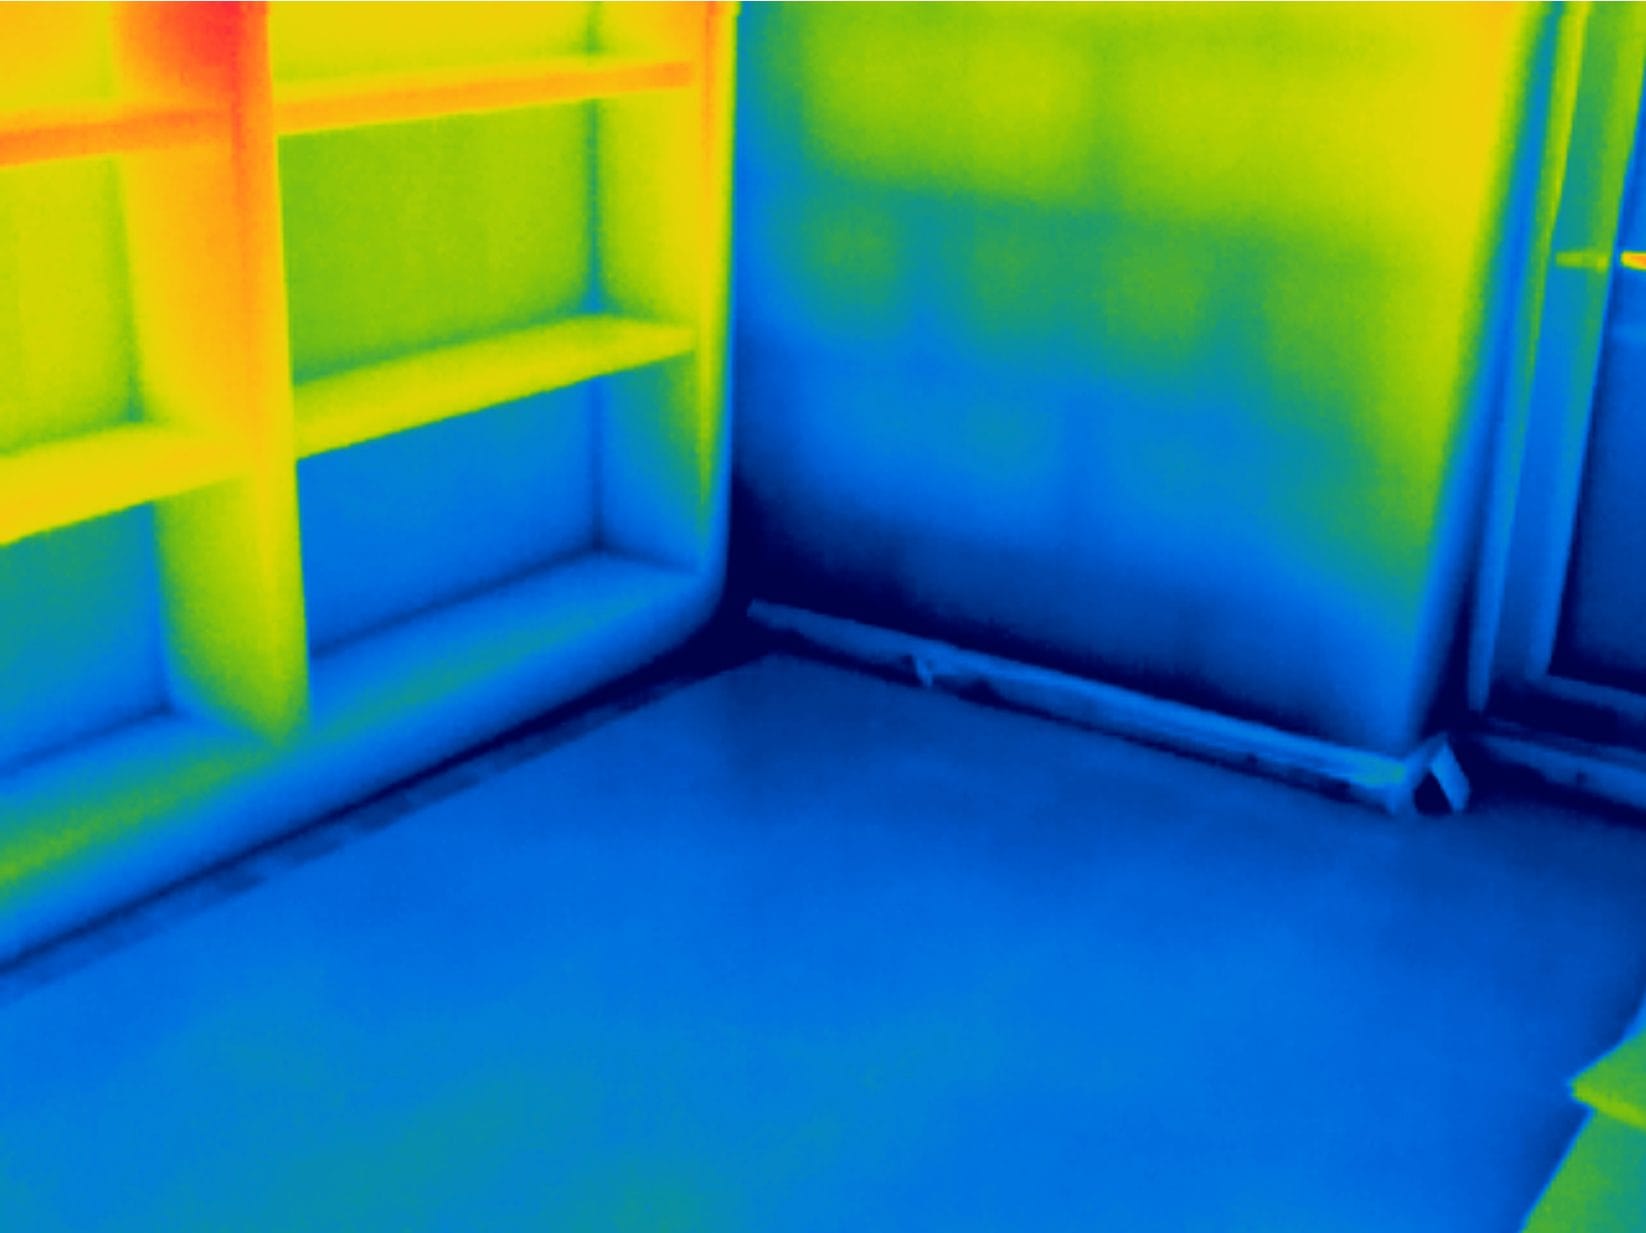
A domestic heat loss survey of a mid-20th-century bungalow with a later flat-roof extension, commissioned ahead of an architectural redesign. Internal and external thermal imaging under controlled conditions identified consistent loft insulation discontinuity contributing to ceiling heat loss, and repeatable thermal bridging and air leakage indicators where window and door frames meet the walls. The flat roof extension performed more uniformly than the original pitched roof. No critical defects were found, and the report gave the client and the design team evidence for planning the refurbishment.
Standards and Certification
Thermographic inspection, analysis and reporting are carried out by a Thermography Services (UK) ITC Level III Certified Master Thermographer (Infrared Training Centre; Certification #205722059), practising in accordance with the frameworks of ISO 18436-7:2014, ASNT SNT-TC-1A and ANSI/ASNT CP-105, and BINDT CMGEN Appendix B (UK training governance). Inspection methodology is aligned with IEC 62446-3:2017 (solar PV) and BS EN ISO 6781-1:2023 (building envelopes) as applicable.
Heat Loss Surveys for Homes
What a home heat loss survey covers
A home heat loss survey covers the parts of a house where warmth escapes: external walls, the loft and roof, ground floors where they can be seen, windows and doors, and the junctions between them. On older properties it often shows how alterations have changed the way the house performs, because an extension, a converted loft or a replacement window can behave very differently from the original fabric around it. The scope is agreed before the survey, so the report answers the question you actually have, whether that is a cold room, a high heating bill or a refurbishment you are planning.
House thermography is used by homeowners before they buy insulation or new glazing, by owners of period properties who want to understand an old building, by architects and builders planning a retrofit, and by landlords managing a portfolio of homes. Building heat loss detection is just as useful after work has been done, to check that new insulation is continuous and that nothing was missed at the eaves, around windows or behind fitted furniture. A thermal survey of a house before and after the work gives you a clear comparison, room by room, of what has changed.
For social landlords, the second phase of Awaab’s Law extends the duty to investigate under The Hazards in Social Housing (Prescribed Requirements) (England) Regulations 2025, SI 2025/1042, to excess cold from 30 November 2026. A thermographic survey is one way to evidence that investigation, alongside the landlord’s own records.
A thermal imaging home inspection you can rely on
A thermal image on its own is only a picture of surface temperature, and a camera can be bought by anyone. What turns it into evidence is the analysis. Every thermal imaging home inspection carried out by Thermography Services (UK) is analysed by our Level 3 thermographer, and every finding is explained in plain language: what the pattern is consistent with, what else could explain it and how confident the analysis is. Each report records the conditions, the coverage and the camera settings, so a later survey can be carried out the same way and compared fairly. Every report is written and certified by our Level 3 thermographer.
Thermography is a qualitative, comparative assessment of surface temperatures under the conditions at the time of the survey. It shows where heat is escaping and what that is consistent with; it does not measure U-values or see inside a wall, and where a finding needs confirming, the report says which further check would confirm it. Findings point to where to investigate; the choice of any work is for your builder, surveyor or energy assessor.
Heat loss surveys are carried out across Sussex, Surrey, Kent, Hampshire, Berkshire and London, including Crawley, Horsham, East Grinstead, Brighton, Guildford, Reigate, Tunbridge Wells, Winchester, Reading and Croydon, and across the UK on request.
The Building Survey Method
The standard behind it
Heat loss surveys follow a method aligned with BS EN ISO 6781-1:2023, Performance of buildings, Detection of heat, air and moisture irregularities in buildings by infrared methods, Part 1: General procedures. It is the current standard for building thermography, and it frames how a survey is planned, the conditions it depends on, how reference temperatures are taken and how irregularities are recorded.
In practice that means a stated inside-to-outside temperature difference, surfaces free of sun and rain, a recorded emissivity and reflected temperature for each surface, and a report that states its conditions and limitations. The survey is qualitative: it identifies surface irregularities consistent with heat loss, missing insulation, thermal bridging or air leakage, and the report keeps each observation separate from its interpretation, so a reader can see what was measured and what was concluded from it.
Request a Heat Loss Survey Quotation
Every home is different, so every heat loss survey is scoped to the property, its construction, the rooms you want covered and the question you need answered. Tell us about the house, what you have noticed, whether internal access is possible and whether the survey is for your own planning, a builder or an energy assessor, and we will come back with a clear proposal and a quotation for the work, including a suitable survey window.


