
The Power of Thermography in Domestic Homes
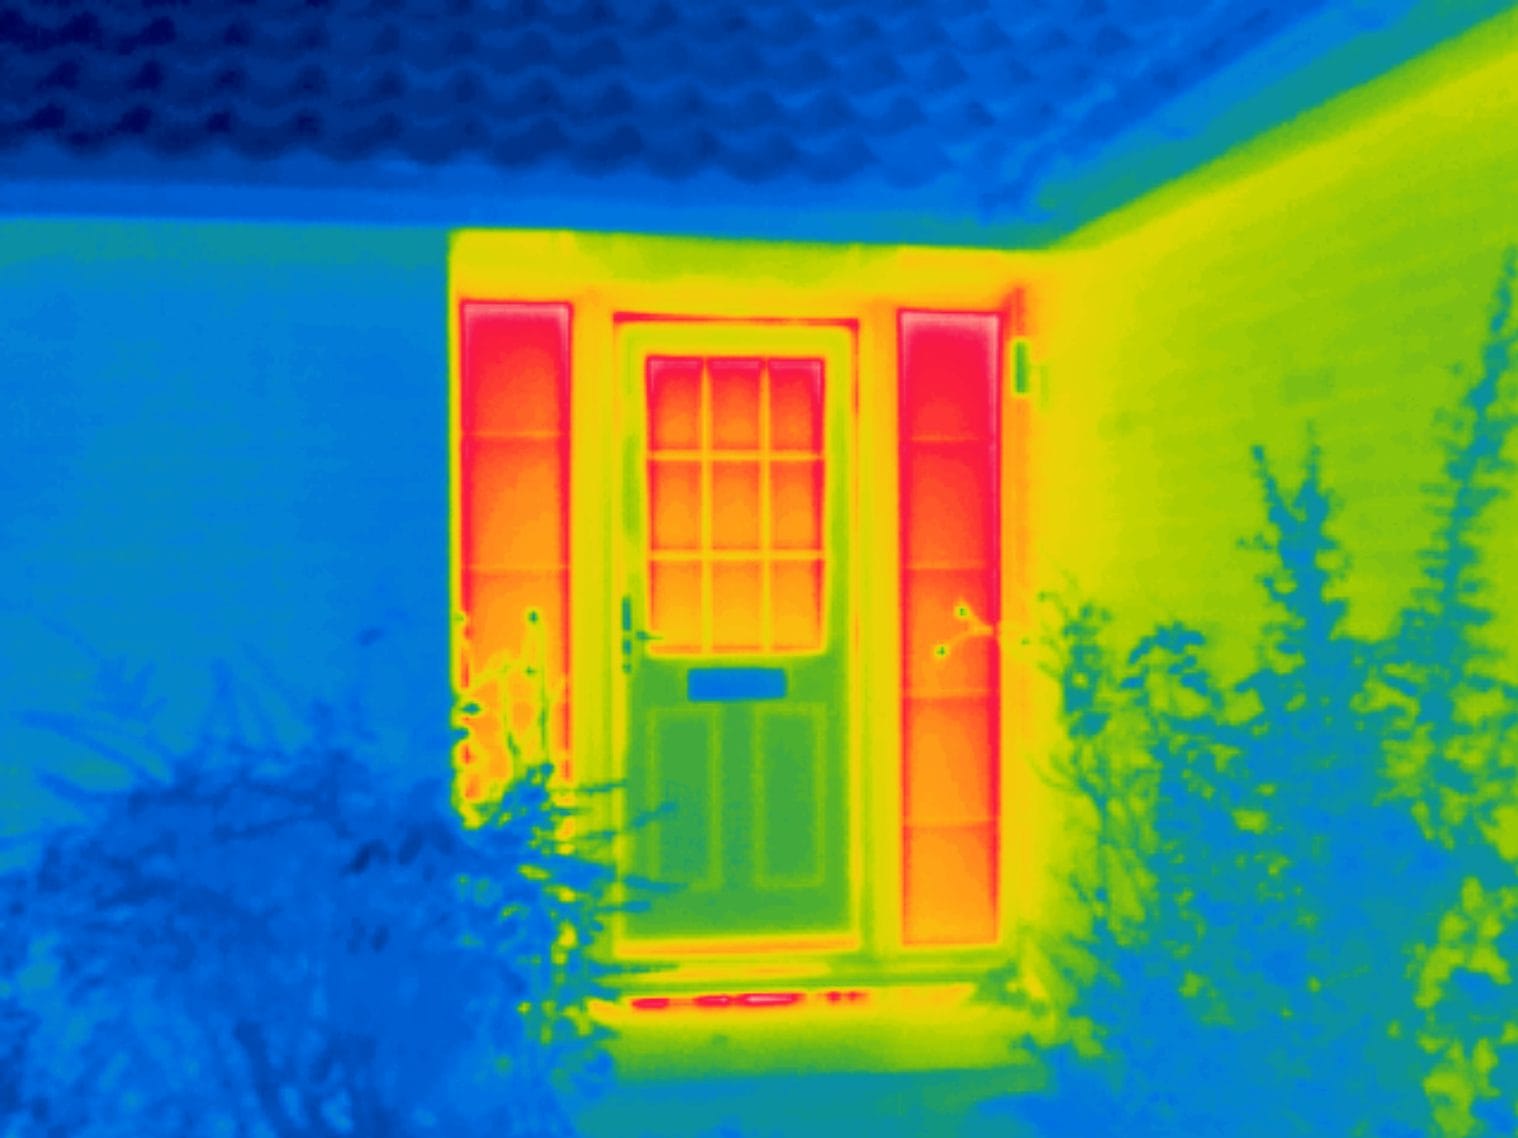
A thermal image of a house is striking: bright patches, dark corners, a roof line glowing against the night sky. It is also easy to misread. A warm patch on a wall can be missing insulation, a radiator on the other side, a flue, or the last of the afternoon sun still leaving the brickwork. Each has a different meaning and a different answer, and the image alone, at a glance, does not say which one you are looking at. That is the whole difference between owning a thermal camera and practising house thermography.
This matters now because the heating season is when homes are imaged, and when most owners first see pictures of their own house, sometimes from a phone attachment, a quick scan or a contractor quoting for work. Those images can be useful, but without the conditions and the analysis behind them they are easy to over-read, in either direction.
This post is for homeowners, buyers and landlords who have a set of thermal images in front of them, or are about to commission some. It explains what a thermal camera actually measures, the handful of patterns that tell most of the story in a home, the features that only look like faults, why the colours on the screen are a choice made by the operator rather than the finding itself, and what an analysed report gives you that a set of images on their own cannot. Every report is written and certified by our Level 3 thermographer.
The Power of Thermography in Domestic Homes
Reading a thermal image of your home, and why the colours are not the answer
Reading a Thermal Image
What the camera measures
A thermal camera does not see heat inside a wall. It measures the infrared radiation leaving a surface and converts it into an apparent surface temperature, pixel by pixel. Two things shape that reading besides the temperature itself. The first is emissivity, how readily a surface gives off infrared: brick, render, plaster, paint and timber all give off most of it, so they read reliably, while glass at an angle and bare or shiny metal give off little and reflect a lot. The second is reflection, the radiation from the surroundings that bounces off the surface into the lens. A window on a clear night can read cold simply because it is reflecting the sky.
That is why house thermography is done under controlled conditions, and why the camera settings and conditions are recorded with every survey.
Why the colours are not the answer
The colours on a thermal image are a palette laid over the temperature data, and the operator chooses the range they span. Set a narrow range and a difference of a fraction of a degree fills the screen with red and purple; set a wide one and the same wall looks almost uniform. Two images of one house taken with different ranges can look like two different buildings. Neither picture is wrong. The finding is the pattern and the measured difference, read against the construction, not how alarming the image looks.
Warm outside, cool inside
Where insulation is thin, missing or wet, more heat passes through the wall or roof. From outside, on a cold night, that area reads slightly warmer than its surroundings; from inside, slightly cooler. The shape tells the analyst more than the temperature does. A neat panel between rafters or joists is consistent with a missing or displaced section of loft insulation. A soft, irregular patch on a cavity wall is consistent with a void in the fill. A whole elevation that reads warmer than its neighbours may simply be a different construction.
Lines that follow the structure
Thermal bridges are places where a more conductive element crosses the insulation: a concrete lintel over a window, the edge of a floor slab, a steel beam, the junction of wall and ceiling. They show as straight, hard-edged lines or bands that follow the building’s geometry. Inside, the same junctions read cooler, which is why bridging so often lines up with the places where condensation and mould appear.
Feathered streaks
Air leakage looks quite different. Cold air entering a heated room cools the surfaces it runs over, leaving a feathered, directional streak that spreads from the gap, typically beneath a window board, along a skirting, around a loft hatch or where a pipe passes through a wall. Seen from outside, warm air escaping at the eaves or around a frame can leave the opposite trace. The direction of the streak points back to the gap.
Things that look like faults but are not
A large part of the analysis is ruling things out. These are the features that most often catch out an untrained eye:
- a radiator, hot water pipe or boiler on the other side of a wall, which shows as a warm, even shape
- vents, flues and extractor outlets, which are meant to release warm air
- walls still giving up heat from sunshine earlier in the day
- reflections in glass, glazed tiles, flashings and metal trims
- surfaces wet from rain, which cool as they dry and can mimic cold spots
- a room just aired, or a door just opened
Each of these is handled in the method rather than guessed at. Our survey protocol photographs and notes every vent, flue, light and recent repair, captures a visual photograph to match every thermal frame, images the north face as a control, and takes reference frames of the sky and the glazing on each elevation so that reflections can be corrected. Faces still in sun are recorded as descriptive only.
Getting the conditions right
None of the patterns above appears reliably unless the house has settled. We ask for the heating to run normally for at least 12 hours, with the building closed up, so that there is at least a 10 °C difference between inside and outside. The survey then takes place before sunrise or about two hours after dark, on a dry day with no sun on the walls being imaged. On a mild afternoon the same house can look perfectly healthy, or alarming, and neither picture would mean much.
From pictures to a report
Good house thermography ends with explanation, not a gallery. For each finding the report sets out what is seen, what it is consistent with, why it happens, what else could explain it and how confident the analysis is, then points to the trade best placed to look further. It never prescribes the repair. Every report is written and certified by our Level 3 thermographer, so the images in front of you come with an answer you can rely on.
BS EN ISO 6781-1:2023
Heat, Air and Moisture
BS EN ISO 6781-1:2023 is the current standard for detecting heat, air and moisture irregularities in buildings by infrared methods, and our building methodology is aligned with its general procedures. The title is worth reading closely. It speaks of irregularities, not measurements: thermography detects places where a surface behaves differently from the surfaces around it, and the analyst then explains what that difference is consistent with. That is why a method aligned with it rests on comparison, recorded conditions and the emissivity and reflected temperature settings described in this post, and why a reliable report always states the conditions under which the images were taken. For a homeowner, it is the reason a thermal survey answers questions about a house rather than simply producing pictures of it.

Have Your Home Surveyed
If you have thermal images of your home that nobody has explained, or you want a survey done well from the start, get in touch. Tell us the age and construction of the house and what prompted the question. We will agree a time when the conditions are right, before sunrise or after dark in the heating season, and every finding will be analysed at Level 3 and explained in a certified report that names the right trade.